
if we have Normal populations and independent observations and ?1 and ?2 are known
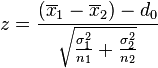
(Wackerly, D., Mendenhall, W., & Scheaffer, R. L., 2001, p. 401)
==========================================================
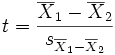
When Unequal sample sizes, unequal variance and unknown variances
http://en.wikipedia.org/wiki/Student’s_t-test#Unequal_sample_sizes.2C_unequal_variance
This test is used only when the two population variances are assumed to be different (the two sample sizes may or may not be equal) and hence must be estimated separately. See also Welch’s t-test. The t statistic to test whether the population means are different can be calculated as follows:
where
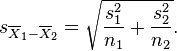
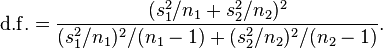
Where s2 is the unbiased estimator of the variance of the two samples, n = number of participants, 1 = group one, 2 = group two. Note that in this case,  is not a pooled variance. For use in significance testing, the distribution of the test statistic is approximated as being an ordinary Student’s t distribution with the degrees of freedom calculated using
- Reinard, J. C. (2006), p.165
This is called the Welch–Satterthwaite equation. Note that the true distribution of the test statistic actually depends (slightly) on the two unknown variances: see Behrens–Fisher problem.
===============================================================================
if the standard deviationof the two populations are the same then the formula will simply depend on variance.
we don’t know what is the population variance it but we can estimate it.
maximum likelihood estimate
is biased but we can show that
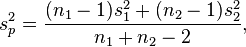
Unbiased least square estimate is
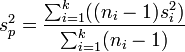
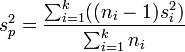
- This mean variance is calculated by weighting the individual values with the size of the subset for each level of x. Thus, the pooled variance is defined by
where n1, n2, . . . nk are the sizes of the data subsets at each level of the variable x, and S12, S22, . . ., Sk2 are their respective variances.

The proof of being unbiased:
E(Sp^2)=((n1-1)E(S1^2)+(n2-1)E(S2^2))/n1+n2-2
=((n1+n2-2)/(n1+n2-2))(sigma^2)=sigma^2
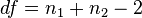
It can be shown that when this estimator is used the statistic is t with n1+n2-2 df

( Wackerly, D., Mendenhall, W., & Scheaffer, R. L. (2001) p.402)
One-way analysis of variance – Wikipedia, the free …
——
Two-way analysis of variance (ANOVA)
examines the influence of two different categorical independent variables on one continuous dependent variable.
-Do changes in the independent variable(s) have significant effects on the dependent variables?
-What are the interactions among the dependent variables?
-And among the independent variables?
![]()
Comments
Estimators for the difference of means of populations — No Comments
HTML tags allowed in your comment: <a href="" title=""> <abbr title=""> <acronym title=""> <b> <blockquote cite=""> <cite> <code> <del datetime=""> <em> <i> <q cite=""> <s> <strike> <strong>