
=-=-=-=-=-=-=-=-=-=-=-=-=-=-=-=-=-=-=-=-=-
https://academic.oup.com/edited-volume/45223/chapter-abstract/387226263?redirectedFrom=fulltext
Categories and Measures of Economic Betterment
|
Category |
Measure/Indicator |
Description |
|
1. Economic Growth |
GDP growth |
Measures total output of goods and services. Often criticized for ignoring distribution and wellbeing. |
|
|
GDP per capita |
Adjusts for population size; a better indicator of average income. |
|
|
PPP (Purchasing Power Parity) |
Adjusts for cost of living; useful for international comparisons of real living standards. |
|
2. Economic Fairness & Distribution |
Gini coefficient |
Measures income or wealth inequality (0 = perfect equality, 1 = extreme inequality). |
|
|
Poverty rate |
Percentage of population below the poverty line. |
|
|
Wealth share of top 1% / bottom 50% |
Indicates concentration of wealth. |
|
3. Employment and Opportunity |
Unemployment rate |
Tracks joblessness; doesn’t always account for underemployment. |
|
|
Labor force participation |
Proportion of working-age people who are working or seeking work. |
|
|
Job quality metrics |
Includes wage levels, benefits, job security. |
|
4. Human Development |
HDI (Human Development Index) |
Combines life expectancy, education, and per capita income. |
|
|
Access to education & health |
Literacy rates, years of schooling, healthcare access. |
|
5. Economic Resilience and Stability |
Inflation rate |
High inflation erodes purchasing power; deflation can stall growth. |
|
|
External debt/GDP ratio |
Measures exposure to financial crises. |
|
|
Budget deficit/surplus |
Indicates fiscal sustainability. |
|
6. Environmental Sustainability |
Carbon emissions per capita |
Indicates ecological cost of economic growth. |
|
|
Ecological footprint |
Measures the environmental impact of consumption. |
|
|
Green GDP |
Adjusts GDP to account for environmental degradation. |
|
7. Subjective Wellbeing |
Happiness index / Life satisfaction surveys |
Measures how people feel about their economic lives. |
|
|
Social trust and security |
Linked to economic anxiety and inclusion. |
.
Answer: Joseph E. Stiglitz (Nobel Memorial Prize in Economic Sciences, 2001) most clearly and explicitly argued that the “invisible hand” result does not hold in real economies except under conditions that do not exist.
Core statement
CONFIRMED
Stiglitz repeatedly states—drawing directly on formal welfare economics—that:
“Whenever there are incomplete markets, imperfect information, or imperfect competition—which are essentially always present—the invisible hand theorem does not apply.”
This is not rhetoric; it is a theorem-level claim grounded in the General Theory of the Second Best and information economics.
Theoretical basis
Arrow–Debreu vs. real economies
CONFIRMED
The invisible-hand result requires:
-
complete markets
-
perfect information
-
no externalities
-
price-taking agents
Stiglitz argues these conditions are never met in real economies because:
“Information is always imperfect and markets are always incomplete.”
(Stiglitz 1987)
Thus, efficiency cannot be assumed even approximately.
Second Best theorem (formal refutation of general applicability)
ATTRIBUTED (but standard and uncontested)
The General Theory of the Second Best (Lipsey and Lancaster 1956) proves that:
If one Pareto condition fails, satisfying the others does not restore efficiency.
Stiglitz explicitly applies this to Adam Smith–style conclusions:
“Once information imperfections are introduced, the decentralized market economy is not constrained Pareto efficient.”
(Stiglitz 1989)
Direct rejection of the invisible hand as empirically relevant
CONFIRMED
Stiglitz states plainly:
“The reason that the invisible hand often seems invisible is that it is not there.”
(Stiglitz 2002)
And further:
“The conditions under which markets are Pareto efficient are so restrictive that they are never satisfied in real economies.”
(Stiglitz 1991)
This is exactly the claim in your question: the invisible hand appears only under conditions that do not exist now.
Comparison with other Nobel laureates
-
Kenneth Arrow (Nobel 1972)
CONFIRMED: Showed that competitive equilibrium requires strong assumptions; emphasized market failure with information asymmetry.
But: More formal and cautious; less explicit rhetorically. -
Amartya Sen (Nobel 1998)
ATTRIBUTED: Criticized welfare conclusions and informational bases of efficiency, but not framed as a direct “invisible hand does not exist” claim. -
Stiglitz
CONFIRMED: Most explicit, repeated, and direct rejection of invisible-hand relevance in actual economies.
Classification summary
-
CONFIRMED: Joseph Stiglitz argues invisible-hand results require conditions that do not exist.
-
CONFIRMED: He bases this on formal economic theory (information economics, second-best).
-
NOT ATTRIBUTED: This is his own stated position, in his own published work.
-
NOT CONTRADICTED: No later retraction or softening exists in his public statements.
References (Chicago author–date, with quoted phrases)
-
Stiglitz, Joseph E. 1987. “The Causes and Consequences of the Dependence of Quality on Price.” Journal of Economic Literature.
“Information is always imperfect and markets are always incomplete.” -
Stiglitz, Joseph E. 1989. “Imperfect Information in the Product Market.” Handbook of Industrial Organization.
“The decentralized market economy is not constrained Pareto efficient.” -
Stiglitz, Joseph E. 1991. “The Invisible Hand and Modern Welfare Economics.” NBER Working Paper.
“The conditions under which markets are Pareto efficient are never satisfied in real economies.” -
Stiglitz, Joseph E. 2002. Globalization and Its Discontents.
“The invisible hand is simply not there.”
Bottom line:
If the question is which Nobel laureate explicitly argued that the invisible hand exists only under unreal conditions, the answer is Joseph Stiglitz.
Corporate Boards Connections

https://hbr.org/2016/04/how-corporate-boards-connect-in-charts
EU and China compete with global investment schemes
Bernd Riegert
10/27/2023
The EU originally set up its global investment scheme to compete with China’s Belt and Road Initiative, which some call the New Silk Road. Over the past 10 years, the communist economy has invested some €900 billion ($948 billion) in infrastructure projects around the world.
https://www.dw.com/en/eu-and-china-compete-with-global-investment-schemes/a-67227221
=-=-=-=-=-=-=-=-=-
Government expenditure, percent of GDP

U.S. government’s total public debt
The U.S. government’s total public debt outstanding through the end of its 2023 fiscal year on 29 September 2023 is nearly $33.167 trillion. The national debt increased by over $2.238 trillion since the end of the government’s 2022 fiscal year.

https://politicalcalculations.blogspot.com/2023/11/september-2023-snapshot-of-who-owns-us.html
=====================================================================
Government expenditure, percent of GDP

https://www.imf.org/external/datamapper/exp@FPP/USA/FRA/JPN/GBR/SWE/ESP/ITA/ZAF/IND/IRN
=-=-=-=-=-=-=-=-=-=-
US national security adviser Jake Sullivan said this week the United States believed there should be high-standard, non-coercive lending options available to low- and middle-income countries.
=-=-=-=-=-=-=-==-
Mundell–Fleming model
https://en.wikipedia.org/wiki/Mundell%E2%80%93Fleming_model
=-=-=-=-=-=-=-=-=-
The federal minimum wage in 2021 was worth 21% less than 12 years ago—and 34% less than in 1968.

=-=-=-=-=-=-=-=-=-=-=-
Industry minister defends Canada’s $13B Volkswagen battery plant subsidy plans

Lucas paradox
Inequality Video Fact Sheet
The figure we use for total global household wealth, $223 trillion, comes from the 2012 Credit Suisse Global Wealth Report.
The figures we use for how the world’s wealth is divided by population cohort also come from the 2012 Credit Suisse Global Wealth Report, as discussed here.
The video says that the richest 300 people on earth have more wealth than the poorest 3 billion. We chose those numbers because it makes for a clear and memorable comparison, but in truth the situation is even worse: the richest 200 people have about $2.7 trillion, which is more than the poorest 3.5 billion people, who have only $2.2 trillion combined.
The claim that inequality between poor countries and rich countries has been increasing and now stands at about 1:80 comes from the United Nations Development Program’s 1999 Human Development Report.
The amount of aid that rich countries give to developing countries each year, about $130 billion, comes from the OECD Aid Statistics report.
The claim that corporations steal more than $900 billion from developing countries each year through tax avoidance comes from a 2012 report from Global Financial Integrity.
The claim that developing countries pay $600 billion each year in debt service comes from the World Bank’s International Debt Statistics databank.
The claim that developing countries lose about $500 billion each year as a consequence of trade rules imposed by rich countries (through the International Monetary Fund and the World Bank) comes from Robert Pollin’s 2003 book Contours of Descent.
Another important fact that the video doesn’t include has to do with land grabs. Fred Pearce’s new book, The Land Grabbers, shows that that land exceeding the size of Western Europe has been grabbed from developing countries by rich-country corporations in the past decade alone. If we could quantify the value of that land we could have added a huge amount to the $2 trillion stack of cash that the video depicts flowing from poor to rich.
It’s also worth drawing attention to a recent Oxfam report that shows that “The richest 1% has increased its income by 60% in the last 20 years, with the financial crisis accelerating rather than slowing the process.”
Source: https://therules.org/inequality-video-fact-sheet/

Net transfer of resources from developing and transition economies to developed countries
Net transfer of resources, including estimates of net illicit financial flows
Net official development assistance (Net ODA)
https://en.wikipedia.org/wiki/Lucas_paradox
https://cepr.org/voxeu/columns/why-does-capital-flow-poor-rich-countries
https://unctad.org/system/files/official-document/presspb2020d2_en.pdf
United Nations Conference on Trade and Development
how poor countries finance the rich
https://www.swissinfo.ch/eng/politics/global-capital-flows–how-poor-countries-finance-the-rich/47007494
=-=-=-=-=-=-=-=-=-=
purchasing power parity (PPP) exchange rate
The rate at which the currency of one country would have to be converted into that of another country to buy the same amount of goods and services in each country.
To understand PPP, let’s take a commonly used example, the price of a hamburger. If a hamburger is selling in London for £2 and in New York for $4, this would imply a PPP exchange rate of 1 pound to 2 U.S. dollars. This PPP exchange rate may well be different from that prevailing in financial markets (so that the actual dollar cost of a hamburger in London may be either more or less than the $4 it sells for in New York). This type of cross-country comparison is the basis for the well-known “Big Mac” index, which is published by the Economist magazine and calculates PPP exchange rates based on the McDonald’s sandwich that sells in nearly identical form in many countries around the world.
https://en.wikipedia.org/wiki/Purchasing_power_parity
+++++++++++++++++++++++++++++
Median Income PPP Countries
https://en.wikipedia.org/wiki/Median_income
https://worldpopulationreview.com/country-rankings/median-income-by-country
https://data.worldbank.org/indicator/NY.GDP.PCAP.PP.CD?end=2021&locations=XP-IR&start=1990
https://www.oecd.org/sdd/leading-indicators/glossaryforoecdcompositeleadingindicators.htm
GDP per capita, PPP (current international $) = GDP per capita based on purchasing power parity (PPP).
- PPP GDP is gross domestic product converted to international dollars using purchasing power parity rates.
- An international dollar has the same purchasing power over GDP as the U.S. dollar has in the United States.
- GDP at purchaser’s prices is the sum of gross value added by all resident producers in the economy plus any product taxes and minus any subsidies not included in the value of the products.
- It is calculated without making deductions for depreciation of fabricated assets or for depletion and degradation of natural resources.
https://data.subak.org/dataset/gdp-per-capita-ppp-current-international
++++++++++++++++++++++++++++++++++
Us debt

2021-Dec-14
==========================
https://www.theguardian.com/global-development-professionals-network/2017/jan/14/aid-in-reverse-how-poor-countries-develop-rich-countries
Developing countries sent $2tn more to the rest of the world than they received. If we look at all years since 1980, these net outflows add up to an eye-popping total of $16.3tn – that’s how much money has been drained out of the global south over the past few decades.
What this means is that the usual development narrative has it backwards. Aid is effectively flowing in reverse. Rich countries aren’t developing poor countries; poor countries are developing rich ones.

========================================================================
This screen shot is taken on 26 Sep 2018 🙂

===========================================================
With low inflation, Firms find it hard to cut wages in many cases—like when a recession strikes, reducing the demand for workers. But if inflation is high, then the real cost of labour can fall even if actual wages don’t (because workers become cheaper relative to the goods they are producing).
The Economist explains
Why the Fed targets 2% inflation
The Economist explains
Sep 13th 2015
by R.A.
===================================================================
Economics
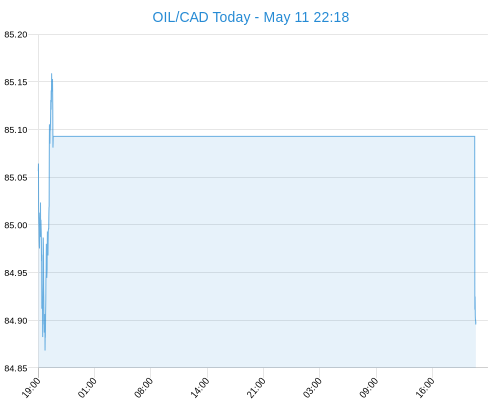
CAD
Crude oil Prices 900mSMA+45c
US Crude inventory https://www.eia.gov/petroleum/supply/weekly/
https://www.eia.gov/dnav/pet/PET_STOC_WSTK_DCU_NUS_W.htm
https://www.eia.gov/opendata/qb.cfm?category=235678
Live Crude Oil Price in Canadian Dollars Today LON Time
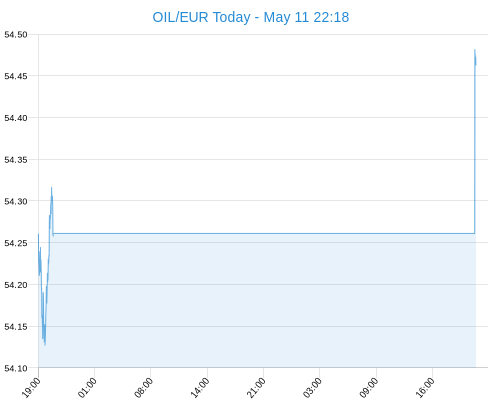
Live Crude Oil Price in Euro Today LON Time
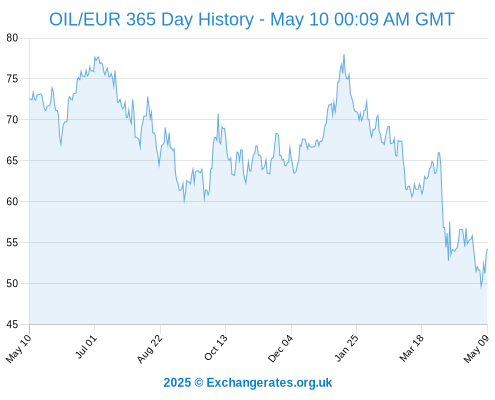
365 day Crude Oil Price in EURO
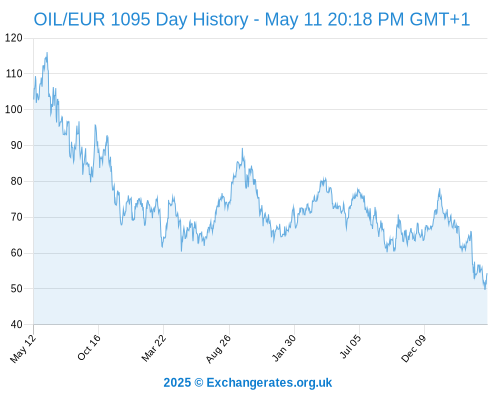
3 year Crude Oil Price in EURO
8 Week US Crude OIL inventory;
http://www.investing.com/commodities/crude-oil-advanced-chart
http://www.investing.com/commodities/crude-oil-streaming-chart
56 days US Crude OIL Price;
After Hours:UCO
http://www.marketwatch.com/investing/fund/uco/charts?countryCode=US
https://www.optionshouse.com After Hour Suggested By Nasdaq Stock Trades: $4.95 per Trade
USDCAD https://www.tradingview.com/chart/8Ema5zp6/
USOIL https://www.tradingview.com/chart/vTuJ8YPQ/
USDCAD https://www.tradingview.com/chart/rekM7OXK/
http://www.nasdaq.com/markets/crude-oil.aspx?timeframe=10y
https://ca.finance.yahoo.com/q?s=UCO
https://atweb.tdwaterhouse.ca/
http://www.macrotrends.net/1369/crude-oil-price-history-chart
==========================================================
Greenspan’s Ideological Flaw was not a mistake
Then I saw:
https://www.youtube.com/embed/WJaW32ZTyKE
No share or id values provided for youtube shortcode.
https://www.youtube.com/watch?v=R5lZPWNFizQ
No share or id values provided for youtube shortcode.
Alan Greenspan: I made a mistake in assuming the the self interest of organizations, specifically banks and others, were such that they were best capable of protecting their own shareholders and their equity in the firms, and it’s been my experience, having worked both as a regulator for eighteen years and similar quantities in the private sector, especially ten years at a major international bank, that the loan officers at these institutions knew far more about the risks involved in the people to whom they lent money that I saw even our best regulators at the Fed capable of doing. So the problem here is something which looked to be a very solid edifice, and, indeed, a critical pillar to market competition and free markets, did break down. And I think that, as I said, shocked me…..
REP. HENRY WAXMAN: The question I have for you is, you had an ideology, you had a belief that free, competitive — and this is your statement — “I do have an ideology. My judgment is that free, competitive markets are by far the unrivaled way to organize economies. We’ve tried regulation. None meaningfully worked.” That was your quote.
You had the authority to prevent irresponsible lending practices that led to the subprime mortgage crisis. You were advised to do so by many others. And now our whole economy is paying its price.
Do you feel that your ideology pushed you to make decisions that you wish you had not made?
ALAN GREENSPAN: Well, remember that what an ideology is, is a conceptual framework with the way people deal with reality. Everyone has one. You have to — to exist, you need an ideology. The question is whether it is accurate or not.
And what I’m saying to you is, yes, I found a flaw. I don’t know how significant or permanent it is, but I’ve been very distressed by that fact.
REP. HENRY WAXMAN: You found a flaw in the reality…
ALAN GREENSPAN: Flaw in the model that I perceived is the critical functioning structure that defines how the world works, so to speak.
How Greenspan’s Framework Went Awry – Daniel Kahnema on assuming Firms as actors
https://www.youtube.com/watch?v=qKaMpvkXpyA
No share or id values provided for youtube shortcode.——————————————–
A short course on cost benefit analysis of sanctions by Madeleine Albright : We think the Price is worth it
http://www.democracynow.org/2004/7/30/democracy_now_confronts_madeline_albright_on
———————————————
Some speculations and some facts
Anomalies that are as important as normality
The Veblen effect is one of a family of theoretically possible anomalies in the general theory of demand in microeconomics. Other related effects include:
the snob effect: preference for goods because they are different from those commonly preferred; in other words, for consumers who want to use exclusive products, price is quality;[3]
the bandwagon effect: preference for a good increases as the number of people buying them increases;
These effects are discussed in a classic article by Leibenstein (1950).[4] The concept of the counter-Veblen effect is less well known, although it logically completes the family.[5]
None of these effects in itself predicts what will happen to actual quantity of goods demanded (the number of units purchased) as prices change—they refer only to preferences or propensities to purchase. The actual effect on quantity demanded will depend on the range of other goods available, their prices, and their substitutabilities for the goods concerned. The effects are anomalies within demand theory because the theory normally assumes that preferences are independent of price or the number of units being sold. They are therefore collectively referred to as interaction effects.
The interaction effects are a different kind of anomaly from that posed by Giffen goods. The Giffen goods theory is one for which observed demand rises as price rises, but the effect arises without any interaction between price and preference—it results from the interplay of the income effect and the substitution effect of a change in price.
Recent research has begun to examine the empirical evidence for the existence of goods which show these interaction effects.[6] The Yale Law Journal has published a broad overview.[7] Studies have also found evidence suggesting people receive more pleasure from more expensive goods.[8]
http://en.wikipedia.org/wiki/Veblen_good
=====================================================================
Ben Bernanke Printing Money 100% confidence!
Ben Bernanke we are printing money, we are not printing money:
http://www.npr.org/blogs/itsallpolitics/2010/12/08/131903366/jon-stewart-busts-fed-s-chair-ben-bernanke-on-printing-money
BERNANKE: Well, this fear of inflation, I think is way overstated. We’ve looked at it very, very carefully. We’ve analyzed it every which way. One myth that’s out there is that what we’re doing is printing money. We’re not printing money. The amount of currency in circulation is not changing. The money supply is not changing in any significant way. …
Twenty-one months earlier on the same program and to the same reporter, Bernanke said something quite different:
Asked if it’s tax money the Fed is spending, Bernanke said, “It’s not tax money. The banks have accounts with the Fed, much the same way that you have an account in a commercial bank. So, to lend to a bank, we simply use the computer to mark up the size of the account that they have with the Fed. It’s much more akin to printing money than it is to borrowing.”
“You’ve been printing money?” Pelley asked.
“Well, effectively,” Bernanke said. “And we need to do that, because our economy is very weak and inflation is very low. When the economy begins to recover, that will be the time that we need to unwind those programs, raise interest rates, reduce the money supply, and make sure that we have a recovery that does not involve inflation.”
=======================================================
Archer Daniels Midland Segment from “Fair Fight in the Marketplace” – YouTube
========================================================
====================================================
=====================================
http://en.wikipedia.org/wiki/Paul_Reichmann
=======================================
CNBC: 1 April 2022
Recession signal: Key Treasury spread flips for first time since 2019
Treasury yields jumped on Friday’s jobs report, one day after the 2-year yield briefly rose above the 10-year yield for the first time since 2019, an inversion that often happens before economic recessions. That spread was on either side of inversion Friday morning. Some data providers showed the 2-year/10-year inverted for a few seconds on Tuesday, but CNBC data did not confirm it at the time.
TREASURY YIELDS
In another key yield spread, which inverted Monday for the first time since 2006, the 5-year and the 30-year flipped again Friday. The short-duration yields going above the longer-dated ones signal the market concerns that the Fed might raise interest rates too quickly. A yield spread on a much shorter time horizon — the 3-month Treasury and the 2-year — has been decidedly positive.
=-=-=-=-=-=-=-=-=-=-=-==-
Oil companies 2023
https://www.investopedia.com/articles/personal-finance/010715/worlds-top-10-oil-companies.asp?utm_source=clubhouse
https://www.offshore-technology.com/features/companies-by-oil-production/?cf-view
https://www.iea.org/reports/oil-market-report-may-2023
1. Saudi Arabian Oil Co. (Saudi Aramco)
- Revenue (TTM): $590.3 billion
- Net Income (TTM): $156.5 billion
- Market Cap: $1.8 trillion
- 1-Year Trailing Total Return: -3.7%
- Exchange: Saudi Arabian Stock Exchange
Saudi Aramco is one of the largest companies in the world across all industries and the largest global oil company by revenue. It is the only company on this list not traded in the U.S. Saudi Aramco is the world’s largest integrated oil and gas company and has facilities in targeted innovation hubs in the United States, Europe, and Asia.23
2. China Petroleum & Chemical Corp. (SNPMF)
- Revenue (TTM): $486.8 billion
- Net Income (TTM): $10.5 billion
- Market Cap: $55.7 billion
- 1-Year Trailing Total Return: 18.6%
- OTC Markets
China Petroleum & Chemical is a producer and distributor of a variety of petrochemical and petroleum products. The company’s products include gasoline, diesel, kerosene, synthetic rubbers and resins, jet fuel, and chemical fertilizers, among other related offerings. Also known as Sinopec, China Petroleum & Chemical is among the very largest oil refining, gas, and petrochemical companies in the world.4
3. PetroChina Co. Ltd. (PCCYF)
- Revenue (TTM): $486.4 billion
- Net Income (TTM): $20.9 billion
- Market Cap: $78.7 billion
- 1-Year Trailing Total Return: 12.5%
- OTC Markets
PetroChina is the publicly listed unit of the state-owned China National Petroleum Corporation. PetroChina is the largest oil and gas producer and distributor in China, contributing approximately 50% and 60% of China’s domestic oil and gas production volume respectively.5
4. Exxon Mobil Corp. (XOM)
- Revenue (TTM): $386.8 billion
- Net Income (TTM): $51.9 billion
- Market Cap: $445 billion
- 1-Year Trailing Total Return: 85.6%
- Exchange: New York Stock Exchange
Exxon Mobil explores, produces, trades, transports, and sells oil and natural gas. An industry leader in profitability in the energy and chemical manufacturing sector, it operates facilities or markets products globally and explores oil and natural gas on six continents. ExxonMobil markets fuels, lubricants, and chemicals under four brands: Esso, Exxon, Mobil, and ExxonMobil.6
5. Shell PLC (SHEL)
- Revenue (TTM): $365.3 billion
- Net Income (TTM): $43.4 billion
- Market Cap: $201.8 billion
- 1-Year Trailing Total Return: 37.47%
- Exchange: New York Stock Exchange
Shell is an international energy company with locations in 70 countries involved in the exploration, production, refining, and marketing of oil and natural gas, and the manufacturing and marketing of chemicals.78
6. TotalEnergies SE (TTE)
- Revenue (TTM): $254.7 billion
- Net Income (TTM): $23.1 billion
- Market Cap: $157.1 billion
- 1-Year Trailing Total Return: 34.3%
- Exchange: New York Stock Exchange
Headquartered in France, TotalEnergies explores and produces crude oil, natural gas, and low-carbon electricity. Total also refines and produces petrochemical products. The company owns and operates gas stations throughout Europe, the U.S., and Africa.910
7. Chevron Corp. (CVX)
- Revenue (TTM): $227.1 billion
- Net Income (TTM): $34.2 billion
- Market Cap: $337.8 billion
- 1-Year Trailing Total Return: 56.8%
- Exchange: New York Stock Exchange
Chevron is an integrated oil company with upstream and downstream operations. The upstream division is involved in the exploration and production of oil and natural gas, while downstream operations cover refining, transportation, and marketing. Chevron is also involved in chemical and mining operations as well as non-energy activities such as technology development.11
8. BP PLC (BP)
- Revenue (TTM): $222.7 billion
- Net Income (TTM): -$11 billion
- Market Cap: $105.3 billion
- 1-Year Trailing Total Return: 38.4%
- Exchange: New York Stock Exchange
British oil company BP is involved in oil and petrochemical exploration, production, and supply. The company refines and sells petroleum products including chemicals such as acetic acid, ethylene, polyethylene, and terephthalic acid. The company’s strategy will pivot from an international oil company focused on producing resources to an integrated energy company focused on delivering solutions for customers. BP brands include Castrol, Aral, and Amoco.1213
9. Marathon Petroleum Corp. (MPC)
- Revenue (TTM): $173 billion
- Net Income (TTM): $12 billion
- Market Cap: $57.1 billion
- 1-Year Trailing Total Return: 85.3%
- Exchange: New York Stock Exchange
Serving customers across the U.S., Marathon refines and ships petroleum products.14 Marathon is a leaseholder or owner of thousands of miles of petroleum pipelines.15 MPC’s marketing system includes branded locations across the United States, including Marathon brand retail outlets.16
10. Valero Energy Corp. (VLO)
- Revenue (TTM): $170.5 billion
- Net Income (TTM): $9.4 billion
- Market Cap: $47.3 billion
- 1-Year Trailing Total Return: 78.3%
- Exchange: New York Stock Exchange
=-=-=-=-=-=-=-=-=-=-=-
Gas companies 2023
=-=-=-=-=-=-=-=-=-=-=-=-==-
Rebalancing Nasdaq
On July 6 2023 , eight components of the Nasdaq 100 accounted for more than 55% of the weighing of the index. In order, these eight components were:
- Microsoft: 13.023% weighting
- Apple: 12.505%
- Nvidia: 6.953%
- Amazon: 6.787%
- Tesla: 4.517%
- Meta Platforms: 4.319%
- Alphabet: Class A shares (GOOGL) 3.748%/Class C shares (GOOG) 3.661%
The new weightings, following the rebalancing, are as follows:
- Apple: 11.616%
- Microsoft: 9.835%
- Amazon: 5.132%
- Nvidia: 4.211%
- Meta Platforms: 3.511%
- Tesla: 3.171%
- Broadcom: 3.085%
- Alphabet: Class A shares (GOOGL) 2.744%/Class C shares (GOOG) 2.719%
https://www.nasdaq.com/articles/the-nasdaq-100-has-been-rebalanced-but-it-still-has-a-big-problem
=-=-=-=-=-=-=-=-=-=-=-=-=-=-=-=-
What is behind the 40% drop in China’s U.S. Treasury holdings?
Market players see Beijing selling American debt to prop up the yuan

=-=-=-=-=-=-=-=-=-=-=-=-=-=-
Answer: Joseph E. Stiglitz (Nobel Memorial Prize in Economic Sciences, 2001) most clearly and explicitly argued that the “invisible hand” result does not hold in real economies except under conditions that do not exist.
Core statement
CONFIRMED
Stiglitz repeatedly states—drawing directly on formal welfare economics—that:
“Whenever there are incomplete markets, imperfect information, or imperfect competition—which are essentially always present—the invisible hand theorem does not apply.”
This is not rhetoric; it is a theorem-level claim grounded in the General Theory of the Second Best and information economics.
Theoretical basis
Arrow–Debreu vs. real economies
CONFIRMED
The invisible-hand result requires:
-
complete markets
-
perfect information
-
no externalities
-
price-taking agents
Stiglitz argues these conditions are never met in real economies because:
“Information is always imperfect and markets are always incomplete.”
(Stiglitz 1987)
Thus, efficiency cannot be assumed even approximately.
Second Best theorem (formal refutation of general applicability)
ATTRIBUTED (but standard and uncontested)
The General Theory of the Second Best (Lipsey and Lancaster 1956) proves that:
If one Pareto condition fails, satisfying the others does not restore efficiency.
Stiglitz explicitly applies this to Adam Smith–style conclusions:
“Once information imperfections are introduced, the decentralized market economy is not constrained Pareto efficient.”
(Stiglitz 1989)
Direct rejection of the invisible hand as empirically relevant
CONFIRMED
Stiglitz states plainly:
“The reason that the invisible hand often seems invisible is that it is not there.”
(Stiglitz 2002)
And further:
“The conditions under which markets are Pareto efficient are so restrictive that they are never satisfied in real economies.”
(Stiglitz 1991)
This is exactly the claim in your question: the invisible hand appears only under conditions that do not exist now.
Comparison with other Nobel laureates
-
Kenneth Arrow (Nobel 1972)
CONFIRMED: Showed that competitive equilibrium requires strong assumptions; emphasized market failure with information asymmetry.
But: More formal and cautious; less explicit rhetorically. -
Amartya Sen (Nobel 1998)
ATTRIBUTED: Criticized welfare conclusions and informational bases of efficiency, but not framed as a direct “invisible hand does not exist” claim. -
Stiglitz
CONFIRMED: Most explicit, repeated, and direct rejection of invisible-hand relevance in actual economies.
Classification summary
-
CONFIRMED: Joseph Stiglitz argues invisible-hand results require conditions that do not exist.
-
CONFIRMED: He bases this on formal economic theory (information economics, second-best).
-
NOT ATTRIBUTED: This is his own stated position, in his own published work.
-
NOT CONTRADICTED: No later retraction or softening exists in his public statements.
References (Chicago author–date, with quoted phrases)
-
Stiglitz, Joseph E. 1987. “The Causes and Consequences of the Dependence of Quality on Price.” Journal of Economic Literature.
“Information is always imperfect and markets are always incomplete.” -
Stiglitz, Joseph E. 1989. “Imperfect Information in the Product Market.” Handbook of Industrial Organization.
“The decentralized market economy is not constrained Pareto efficient.” -
Stiglitz, Joseph E. 1991. “The Invisible Hand and Modern Welfare Economics.” NBER Working Paper.
“The conditions under which markets are Pareto efficient are never satisfied in real economies.” -
Stiglitz, Joseph E. 2002. Globalization and Its Discontents.
“The invisible hand is simply not there.”
Bottom line:
If the question is which Nobel laureate explicitly argued that the invisible hand exists only under unreal conditions, the answer is Joseph Stiglitz.
![]()