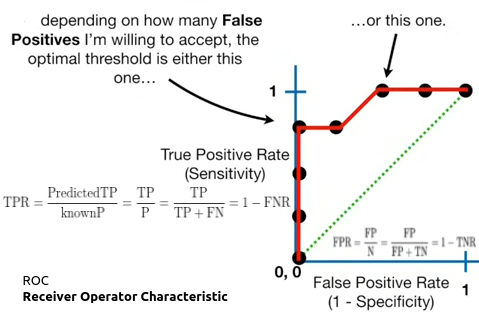
A receiver operating characteristic curve, or ROC curve, is a graphical plot that illustrates the diagnostic ability of a binary classifier system as its discrimination threshold is varied. The method was originally developed for operators of military radar receivers
Videos
| Topic | Access |
|---|---|
| Train, Test, & Validation Data Sets (7 min) | https://www.youtube.com/watch?v=Zi-0rlM4RDs |
| Confusion Matrix (7 min) | https://www.youtube.com/watch?v=Kdsp6soqA7o |
|
ROC and AUC, Clearly Explained (16 min) |
https://www.youtube.com/watch?v=4jRBRDbJemM |
| Evaluating Classifiers: Gains and Lift Charts ( 14 min) | https://www.youtube.com/watch?v=1dYOcDaDJLY |
Articles
| Medium | Topic | Access |
|---|---|---|
| Excercise | Understanding Confusion Matrix in R | https://www.datacamp.com/community/tutorials/confusion-matrix-calculation-r |
| Exercise with Answer | Model Evaluation | https://www.r-exercises.com/2016/12/02/model-evaluation-exercise-1/ |
| Exercise with Answer | Model Evaluation | https://www.r-exercises.com/2016/12/22/model-evaluation-2/ |
| Tutorial | Lift Charts Updated by IBM |
https://www.ibm.com/docs/en/spss-statistics/28.0.0?topic=customers-cumulative-gains-lift-charts |
| Tutorial | Generate ROC Curve Charts for Print and Interactive Use | https://cran.r-project.org/web/packages/plotROC/vignettes/examples.html |
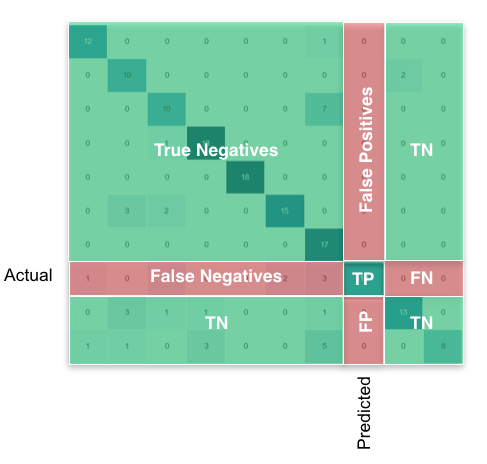
From a confusion matrix
- condition positive (P)
- the number of real positive cases
- condition negative (N)
- the number of real negative cases
- true positive (TP)
- True positive Prediction=A test result that correctly indicates the presence of a condition or characteristic
- true negative (TN)
- True negative Prediction=A test result that correctly indicates the absence of a condition or characteristic
- false positive (FP)
- False positive Prediction=A test result which wrongly indicates that a particular condition or attribute is present
- false negative (FN)
- False negative Prediction=A test result which wrongly indicates that a particular condition or attribute is absent
-
sensitivity
- sensitivity, recall, hit rate, or true positive rate (TPR)
-
specificity
- specificity, selectivity or true negative rate (TNR)
-
precision
- precision or positive predictive value (PPV)
- negative predictive value (NPV)
- miss rate or false negative rate (FNR)
- fall-out or false positive rate (FPR)
- false discovery rate (FDR)
- false omission rate (FOR)
- Positive likelihood ratio (LR+)
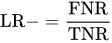
- Negative likelihood ratio (LR-)
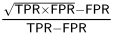
- prevalence threshold (PT)
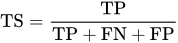
- threat score (TS) or critical success index (CSI)








- Prevalence
-
rpp (Rate of Positive Predictions)
rpp = (tp+fp)/(tp+fn+fp+tn)
When rpp is 0.1, the number of times we have had some positive prediction are 10% of the total(regardless of our goodness)
-
Accuracy
- accuracy (ACC)
- balanced accuracy (BA)
- F1 score
- is the harmonic mean of precision and sensitivity:
- phi coefficient (φ or rφ) or Matthews correlation coefficient (MCC)
-
- Fowlkes–Mallows index (FM)
-
- informedness or bookmaker informedness (BM)
-
- markedness (MK) or deltaP (Δp)
-
- Diagnostic odds ratio (DOR)
-


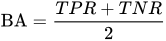





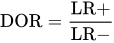
Sources: Fawcett (2006),[2] Piryonesi and El-Diraby (2020),[3] Powers (2011),[4] Ting (2011),[5] CAWCR,[6] D. Chicco & G. Jurman (2020, 2021),[7][8] Tharwat (2018).[9]
==================================================================================
#To create a confusion matrix with complete analysis of measures
library(caret)
KNNconfusionMatrix<-caret::confusionMatrix(Predictionsvector,actualvector)
KNNconfusionMatrix
#Easiest and best visualization gain and lift in R:
#install.packages(‘CustomerScoringMetrics’)
library(CustomerScoringMetrics)
CustomerScoringMetrics::cumGainsChart(Predictionsvector,actualvector)
CustomerScoringMetrics::liftChart(Predictionsvector,actualvector)
# ROC gain lift With more elaboration in R
##################################################
# Create a prediction object from predictions and actuals of any test data
# Then by Various performance analysis you will have ROC , cumulative gain and lift charts
# rpp = (tp+fp)/(tp+fn+fp+tn) (Rate of Positive Predictions)
#################################################
ROCRpredictionObjfromAnyModel<-ROCR::prediction(as.numeric(PredictionsfromAnyTestset),as.numeric(ActualsfromAnyTestset))
plotableROC<- ROCR::performance(ROCRpredictionObjfromAnyModel,measure=”tpr”,x.measure=”fpr”)
plot(plotableROC, col=”orange”, lwd=2, main=”ROC curve for blah blah”)
plotableGain<- ROCR::performance(ROCRpredictionObjfromAnyModel,measure=”tpr”,x.measure=”rpp”)
plot(plotableGain, col=”orange”, lwd=2, main=”Gaincurve for blah blah”)
#################################################
# For example we will create a prediction object from KNN model prediction vector
#####################################################
ROCRpredictionObjfromKNN<-ROCR::prediction(as.numeric(amirKNNextraxtedPredictionsvector),as.numeric(actualvectoradmitancefromtestdata))
# Now we will use the prediction object we created above as a parameter that we pass to performance function
# this performance object will contain tpr and fpr
# ROC Chart:
ROCKNN <- ROCR::performance(ROCRpredictionObjfromKNN,measure=”tpr”,x.measure=”fpr”)
# if we plot tpr vs fpr it is ROC by definition 🙂
plot(ROCKNN, col=”orange”, lwd=2, main=”ROC curve ROCRpredictionObjKNN”)
# Now we will use the prediction object we created above as a parameter that we pass to performance function
# this performance object will contain tpr and rpp (Rate of Positive Predictions)
# if we plot tpr vs rpp it is Gains chart by definition 🙂
# Gains Chart:
gainKNN <- ROCR::performance(ROCRpredictionObjfromKNN,measure=”tpr”,x.measure=”rpp”)
plot(gainKNN, col=”orange”, lwd=2, main=”gain curve KNN”)
# Lift Chart:
liftchartKNN<-ROCR::performance(ROCRpredictionObjfromKNN,”lift”,”rpp”)
plot(liftchartKNN, main=”Lift curve KNN”, colorize=T)
#AUC
library(ROCit)
roc_empirical <- ROCit::rocit(score = as.numeric(amirKNNextraxtedPredictionsvector), class = as.numeric(actualvectoradmitancefromtestdata), negref = 1)
# to get the area under the curve = AUC
summary(roc_empirical)
plot(roc_empirical)
=============================================
http://mlwiki.org/index.php/Cumulative_Gain_Chart
https://www.ncbi.nlm.nih.gov/pmc/articles/PMC4608333/
https://idswater.com/2020/09/19/what-is-a-gain-chart/
http://www2.cs.uregina.ca/~dbd/cs831/notes/lift_chart/lift_chart.html
AUC: https://www.r-bloggers.com/2016/11/calculating-auc-the-area-under-a-roc-curve/
https://www.rdocumentation.org/packages/caret/versions/5.07-001/topics/predict.train
https://www.datanovia.com/en/lessons/determining-the-optimal-number-of-clusters-3-must-know-methods/
https://cran.r-project.org/web/packages/ROCit/index.html
=================================
https://en.wikipedia.org/wiki/Confusion_matrix
Other metrics can be included in a confusion matrix, each of them having their significance and use.
| Predicted condition | Sources: [22][23][24][25][26][27][28][29][30] | ||||
| Total population = P + N |
Positive (PP) | Negative (PN) | Informedness, bookmaker informedness (BM) = TPR + TNR − 1 |
Prevalence threshold (PT) = TPR × FPR − FPR TPR − FPR |
|
|
Actual condition
|
Positive (P) | True positive (TP), hit |
False negative (FN), type II error, miss, underestimation |
True positive rate (TPR), recall, sensitivity (SEN), probability of detection, hit rate, power = TP/P= 1 − FNR |
False negative rate (FNR), miss rate = FN/P= 1 − TPR |
| Negative (N) | False positive (FP), type I error, false alarm, overestimation |
True negative (TN), correct rejection |
False positive rate (FPR), probability of false alarm, fall-out = FP/N= 1 − TNR |
True negative rate (TNR), specificity (SPC), selectivity = TN/N= 1 − FPR |
|
| Prevalence = P/P + N |
Positive predictive value (PPV), precision = TP/PP= 1 − FDR |
False omission rate (FOR) = FN/PN= 1 − NPV |
Positive likelihood ratio (LR+) = TPR/FPR |
Negative likelihood ratio (LR−) = FNR/TNR |
|
| Accuracy (ACC) = TP + TN/P + N | False discovery rate (FDR) = FP/PP= 1 − PPV |
Negative predictive value (NPV) = TN/PN= 1 − FOR | Markedness (MK), deltaP (Δp) = PPV + NPV − 1 |
Diagnostic odds ratio (DOR) = LR+/LR− | |
| Balanced accuracy (BA) = TPR + TNR/2 | F1 score = 2 PPV × TPR/PPV + TPR = 2 TP/2 TP + FP + FN |
Fowlkes–Mallows index (FM) = PPV × TPR | Matthews correlation coefficient (MCC) = TPR × TNR × PPV × NPV − FNR × FPR × FOR × FDR |
Threat score (TS), critical success index (CSI), Jaccard index = TP/TP + FN + FP | |



Confusion matrices with more than two categories
Confusion matrix is not limited to binary classification and can be used in multi-class classifiers as well.[31] The confusion matrices discussed above have only two conditions: positive and negative. For example, the table below summarizes communication of a whistled language between two speakers, zero values omitted for clarity.[32]
|
Perceived
vowel Vowel
produced |
i | e | a | o | u |
|---|---|---|---|---|---|
| i | 15 | 1 | |||
| e | 1 | 1 | |||
| a | 79 | 5 | |||
| o | 4 | 15 | 3 | ||
| u | 2 | 2 |