
When we don’t know the parameter of a population we have to use our sample data to predict the parameter.
Frequentists confidence interval
Let us assume we know that the population mean is mu and standard deviation is sigma.
if we take all possible samples from the population – according to central limit theorem –
95.4% of sample means will end up to be within the range of -2sigma/sqrt(n) and +2sigma/sqrt(n) around mu.
the Xbar will be within -2sigma/sqrt(n) and +2sigma/sqrt(n) far from the mu 95.4% of the time.
This means when we get an Xbar from our sample, there is 95.4% chance that this specific Xbar is within -2sigma/sqrt(n) and +2sigma/sqrt(n) far from the mu.
this mean that 95% of the time the range of -2sigma/sqrt(n) and +2sigma/sqrt(n) around xbar covers mu.
============================================================================
Prediction interval
is the probability of an event in the population to happen based on the sample statistics.
the best estimate for mu is xbar.
the best estimate for sigma we should use to estimate the next event based on the past events is Sx*(sqrt(n+1/n)) with a T distribution of n-1 df
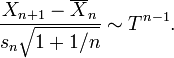 this shown to be T
http://en.wikipedia.org/wiki/Prediction_interval#Unknown_mean.2C_unknown_variance
for n=10
sigma=s*1.049 but we have to go to row 9 of T table and go 2.262sigma around the mean 2.3724s
which is more than using unbiased estimator for sigma and using normal.
If we use the Unbiased rule-of-thumb estimation of standard deviation
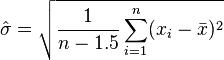 =
=  if the above is T then we must use t distribution here for prediction
\hat{\sigma}=\sqrt{\frac{2(n-1)}{2n-3}}S_x
sigma=s*1.029 and we go to 2.262 sigma around the mean 2.328s
or
if we use the Unbiased estimation of standard deviation
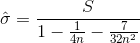 then use T distribution for prediction
http://en.wikipedia.org/wiki/Unbiased_estimation_of_standard_deviation
for n=10
sigma=s*1.0274 and we go to 2.262 sigma around the mean which is 2.324s
============================================================================
Credible interval
Let us assume that we don’t know anything about population and we take a sample with a mean of Xbar.
One can claim that mu is closer than Xbar-2sigma/sqrt(n).
if we accept that as H.
P(closer than O|H) is 47.6%.
P(closer than O|H)=P(closer than O|H)*(P(H)/P(O)
but for us, who don’t know anything about that population P(H) and P(O) are the same.
Therefore
P(closer than O|H)=P(closer than O|H)
In this case with no prior information confidence interval and credible interval are the same.
=============================================================================
http://www.webapps.cee.vt.edu/ewr/environmental/teach/smprimer/intervals/interval.html
![]()